Create a combinatorial annotation
First, check below categorical annotations to be combined. Second, select items in each annotation. Then, click . The max combinatorial number
Create abbreviations of annotations
Choose annotation(s):
Add genes of interest for plotting
Please input a list of genes separated by comma, semicolon, space or tab:
The following genes were added (click on a gene name to remove):
The following genes are not in the data:
User-defined gene sets:
Add gene sets of interest manually
Gene set name: Gene names:
Load gene sets from a text file
geneset1: ACTB, Gapdh
geneset2: BTK, CD4
Add gene sets from databases
Genes detected in cell selections
In selection 1 (0) cells and selection 2 (0) cells
Expression cutoff:
Marker genes of annotation categories from selected cells
Choose cell selection(s):
Select an annotation:
By method: with the number of genes per group:
Violin plot of a gene from selected cells
Choose cell selection(s):
Choose a gene ('Add Genes' first):
Expression cutoff for cell filtering:
Group by:
Plot sub-grouped violin
Choose cell selection(s):
Choose a gene ('Add Genes' first):
Expression cutoff (for cell filtering):
Expression cutoff (for percentage calculation):
Group by:
Sub-group by:
Stacked violin plot of genes from selected cells
Choose cell selection(s):
Choose genes ('Add Genes' first): Uncheck / Check All
Expression cutoff for cell filtering:
Select user-defined gene sets: Uncheck / Check All
Collapsing the above gene sets: Yes No
By: Average Median
Group by: as
Color: Reverse
Violins of selected genes splitted on two group annotations plot1cell
Choose cell selection(s):
Choose genes ('Add Genes' first): Uncheck / Check All
Expression cutoff for cell filtering:
Group by (row panels):
Sub-group by (within a subpanel):
Width: Height:
Heatmap of selected cells and genes
Choose cell selection(s):
Choose genes ('Add Genes' first): Uncheck / Check All Using protein atlas annotation
Or upload a gene annotation csv file (first column header is 'gene'):
Choose categorical annotation(s):
Choose continuous annotation(s):
Select plotting value:
Color: Reverse
Select plotting methods:
Gene as Column Row
Width: Height:
Annotation fontsize adjust:
Cluster by:
Change the annotation order by dragging items up or down, cluster annotations can also be removed by clicking :
Gene specificity for groups in an annotation
Choose cell selection(s):
Choose genes (If no gene select, all gene will be used.): Uncheck / Check All
Select an annotation for specificity:Dot plot shows per group, the fraction of cells expressing a gene (dot size) and the mean expression of the gene in those cell (color scale)
Choose cell selection(s):
Choose genes ('Add Genes' first): Uncheck / Check All
Expression cutoff for cell fraction (dot size):
Expression is averaged only over cells expressing a given gene above the cutoff: YesNo
Select user-defined gene sets: Uncheck / Check All
Collapsing the above gene sets: Yes No
By: Average Median
Group by:
Adjust the legend width:
Color: Reverse
Note: Unscaled data is used as the visualiztion is hard to interpret for scaled or corrected matrices in which zero counts had been replaced by other values. Scaling option in Global Setting does not apply to Dot plot
Embedding plots of selected genes and/or annotations
Choose cell selection(s):
Choose categorical annotation(s):
Choose continuous annotation(s):
Choose genes ('Add Genes' first): Uncheck / Check All
Split by:
Select the embedding layout: the number of plots per row:
Track plot represents the gene expression by height
Choose cell selection(s):
Choose genes ('Add Genes' first): Uncheck / Check All
Select user-defined gene sets: Uncheck / Check All
Collapsing the above gene sets: Yes No
By: Average Median
Group by:
Density plots of selected genes
Choose cell selection(s):
Choose genes ('Add Genes' first): Uncheck / Check All
Split by:
Color by:
Bandwidth: controls how tightly the curve fits to the data, like the bin size in a histogram.
Density Scatter plot shows the expression relationship of two genes. The color of each hexagon denotes the number of cells in it.
Choose cell selection(s):
Choose two genes ('Add Genes' first):
Expression cutoff:
Number of hexagons: The higher the number, the less cells in a hexagon.
Embedding plot of two genes from selected cells
Choose cell selection(s):
Expression cutoff:
Select the embedding layout:
Interactive sankey diagram of annotations and/or genes from selected cells
Choose cell selection(s):
Choose genes ('Add Genes' first): Uncheck / Check All
Number of equally divided gene expression ranges:
Choose annotation(s):
Change the order by dragging items up and down:
Please specify the diagram width per category: and the diagram height:
Find differentially expressed genes
Selection 1 (0) cells and selection 2 (0) cells
Differentially expressed genes will be detected between the two cell gorups defined above, unless two categories of the 'Custom_combine' annotation are selected, which enables DE analysis between those two:
Select the number of top DEG:
Select the method:
Select genes to be marked in the volcano plot: Uncheck / Check All
Define the significance in FDR > and absolute log2(FC) >
Remove genes in volcano plot with the absolute log2(FC) larger than:
Label Size: Dot Size:
Y-axis Min: Y-axis Max:
Note: Unscaled data is used. Scaling option in Global Setting does not apply to DEG.
Plot volcano for the pre-computed DEGs
Select genes to be marked in the volcano plot: Uncheck / Check All
Select the number of top DEG:
Define the significance in FDR < and absolute log2(FC) >
Label Size: Dot Size:
Y-axis Min: Y-axis Max:
Remove genes in volcano plot with the absolute log2(FC) larger than:
Plot the bubble heatmap for pre-computed DEGs from multiple comparisons
Select genes to be included in the bubble heatmap (rows): Uncheck / Check All
Select comparisons from the table (shift/Ctrl for multi-selections) to be included in the bubble heatmap (columns):
Change the order by dragging items up and down:
Bubble distance in plot:
Gene Set Enrichment Analysis by fgsea
Please select the gene sets: Gene set definitions and more.
The gene sets with minimal size: and maximal size:
The significant padj cutoff in the plot:
Plot the significant top (ranked by pval) up: and down:
Collapse similar gene sets in the plot:
Interactive stacked barplot of cell distribution of selected cells over two annotations and/or genes
Choose cell selection(s):
Choose two from genes and annotations ('Add Genes' first):
Number of equally divided gene expression ranges:
Annotations:
Color by
Figure width: , height:
x-Axis font size: , label rotate: , label shift:
Jointly visualizing gene expression and DNA accessibility
Jointly visualizing histology image, cell boundaries, transcript locations
Select coordinates: Local Global
Choose transcripts to hightlight Choose color for selected transcriptsChoose the size for transcript markers:
Global setting for VIP
Select cells cumulatively: Yes No
|
Scale gene expression to unit variance and zero mean Yes No
Genes with no variation are retained and set expression values to 0 during this operation
Clip to a maximum value of
Width of the central canvas of main window in pixel:
Figure DPI (Dots Per Inch, for PNG only):
Figure format:
Font size:
Vector friendly: Yes, plot mass components using png No, all are vectors.
Transparent figure: Yes No
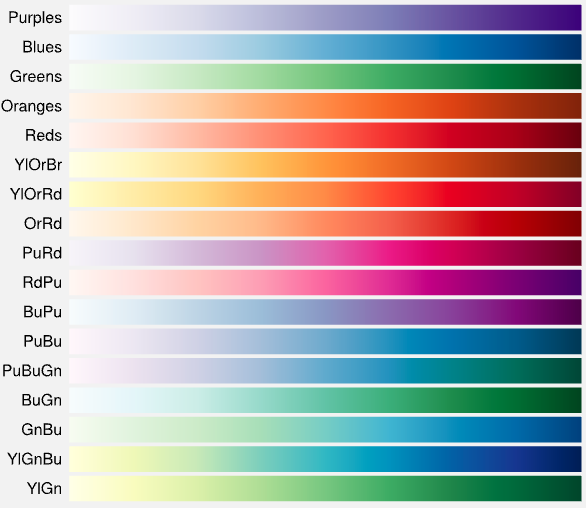
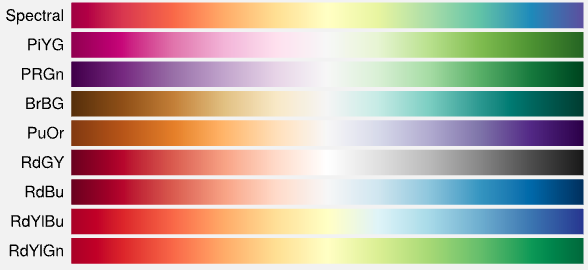
Colormap of Embedding Plot (all available), Density Scatter (limited to top 4 colormaps): Reverse
| viridis | 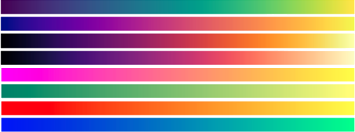 |
| plasma | |
| inferno | |
| magma | |
| spring | |
| summer | |
| Fall | |
| winter |
Image resolution: High Low
Move embedding and image together: Yes No
Image on the front: Yes No
Image Opacity: 0.75
Embedding Opacity: 1
Choose slides to arrange: Uncheck / Check All
Click on an image to operate:
Flip X Flip Y Rotate: 0 degree
CLI to operate on data directly
Choose cell selection(s):
Choose genes ('Add Genes' first): Uncheck / Check All
Choose annotation(s):
Choose layout:
Test VIP functionalities
Load saved session
Load from a url? Yes No
Run plotting after loading? Yes No